
Table 2: List of main financing instruments and mechanisms
| Instrument | Description |
|---|---|
| Grants | Cash contributions for development projects, often targeted to create favourable conditions for enterprises, enabling them to become commercially viable or improve access to loans. |
| Non-concessional loans | Loans provided at market rates, typically to projects or countries with lower risk. These loans must be repaid with interest and are generally offered by development finance institutions or commercial banks. |
| Concessional loans | Loans offered at below-market rates, with longer repayment periods and lower interest rates to support projects with significant social or environmental impact, often in lower-income countries. |
| Equity | Direct investment in an enterprise, providing ownership stake rather than debt. This approach allows for potential return on investment and can help catalyse private-sector investment in development projects. |
| Bonds | Debt securities issued by governments or institutions to raise funds for development projects. These can include green bonds, social bonds and impact bonds aimed at financing specific development outcomes. |
| Guarantees | Financial promises to cover loan defaults, mitigating risks for lenders and encouraging investment in high-risk areas or projects by protecting against potential losses. |
| First loss capital | Investment or funding that absorbs initial losses in a project, reducing risk for other investors and attracting additional capital by providing a safety buffer to de-risk investments. |
| Insurance | Financial products that protect against specific risks, such as natural disasters or political instability, allowing development projects to proceed by mitigating potential losses. |
| Results-based finance | Funding that is disbursed based on the achievement of predefined results or outcomes, incentivizing efficiency and effectiveness in project implementation. |
| Blended finance | Combining concessional funds (grants or concessional loans) with private investment to increase resources for development projects, typically by de-risking and making investments more attractive to private investors. |
| Trust funds | Pooled funds managed by institutions or governments to finance targeted development projects, often focused on specific sectors or regions. |
| Micro-finance institutions | Organizations that provide small loans and financial services to low-income individuals or small enterprises, supporting financial inclusion and economic development at the grassroots level. |
4 The Sources and Scale of Financing for Agrifood Systems
To understand how additional financing for agrifood systems transformation could be catalysed, and the leveraging potential of blended financing mechanisms, it is necessary to understand the current sources of financing. This section considers development finance, national government finance and private finance. For the latter, a distinction needs to be made between investments from capital markets, large agrifood sector firms and smaller-scale farming and agrifood sector enterprises.
Significant challenges remain in assessing financing for agrifood systems. First, there is no universally agreed understanding of what constitutes a “food system” or what outcomes should be included within agrifood systems financing. Depending on the framing, agrifood systems outcomes may encompass food insecurity and associated social protection in low-income countries, emergency food aid in fragile contexts, addressing malnutrition linked to both under and overconsumption of balanced diets, supporting adaptation to climate hazards and risks, and growing the commercial agrifood sector to strengthen food supply and economic development.
As a result of this lack of definitional clarity, financing and accounting frameworks struggle to capture agrifood systems as a coherent category. National and global accounting systems do not treat agrifood systems as a distinct sector or entity; instead, reporting is often fragmented across agriculture, food and beverage sectors, and broader manufacturing categories that include food processing. Similarly, OECD Development Assistance Committee (DAC) categories for ODA financing are difficult to map directly onto agrifood systems as an overarching category, as they are also reported across separate purpose codes.
As emphasized in the SOFI 2024 report, what is included in the definition of “financing for food systems” significantly influences estimates of the resources currently available. In one set of estimates, the average annual total of ODA for food security and nutrition varied almost 10-fold, from US$6.9 billion to US$62 billion, depending on the definition of agrifood systems investments.48 To address the challenge of characterizing both current flows and estimated future needs, methodologies like the one piloted in the SOFI 2024 report as well as the Financial Flows to Food Systems (3FS) tool (see box 7 below) provide a more explicit and systematic structure to defining what counts as funding for agrifood systems.
This section therefore looks across differing definitions and information sources to provide as much clarity as currently possible regarding the overall financing ecosystem for agrifood systems, globally and specifically for LICs and MICs. Table 3 summarizes available estimates of development finance and private finance flows to agrifood systems. The estimates highlight that investments by producers and SMEs themselves, as well as domestic public support from LIC and MIC governments, substantially exceed international development finance flows.
Box 7: The Tracking Financial Flows to Food Systems (3FS) Tool
Established by IFAD and the World Bank, this tool is designed to track the public sector, ODA and private sector flows to food systems. It integrates five areas of investment – agricultural development and value chains, infrastructure for food systems, nutrition and health, social assistance, and climate and natural resources. The tool is being piloted in three countries: Kenya, Niger and Peru. The tool aims to create the data needed for game changing policies for food systems financing. Find out more about 3FS here.
Table 3. Estimates of annual financing for agrifood systems in LICs and MICs by source and type of finance
| Instrument | Official development assistance and other official flows | DFIs | Private finance | LIC and MIC national governments | Climate finance |
|---|---|---|---|---|---|
| Grants | US$50 billion in 2021a With narrower definition, US$23 billion in 2021 and US$25.5 billion in 2024 | US$4 billiona (philanthropy) | US$276 billion (subsidies estimated in 2030)b | US$10.83 billiond | |
| Concessional loans | US$50 billion in 2021a With narrower definition, US$23 billion in 2021 and US$25.5 billion in 2024 | US$29 billionc (regional development banks) | US$12.5 billiond | ||
| Commercial loans | US$29 billionc (regional development banks) | US$19 billiona (foreign direct investment) US$2 billiona (domestic banks) US$630 million in private equitye | US$12.5 billiond | ||
| Blended finance | US$1.2 billiona (concessional) US$1.9 billion in 2024 | US$523 millionc | US$8 billionc US$4.6 billion in 2024 | ||
| Remittances | US$371 billiona ($341 billion for food consumption, US$30 billion invested in agrifood systems) | ||||
| Individual farmer/SME investment | US$412 billiona |
a SOFI 2024.
b FAO, UNDP and UNEP. 2021. “A Multi-Billion-Dollar Opportunity – Repurposing Agricultural Support to Transform Food Systems.” FAO, UNDP, and UNEP. https://doi.org/10.4060/cb6562en.
c Perera, O., Smaller, C., El Harty, K. and Lefebvre, L. 2024. Unleashing the Catalytic Power of Donor Financing to Achieve Sustainable Development Goal 2: Technical note. GDPRD and Shamba Centre for Food & Climate.
d Chiriac, Daniela, Harsha Vishnumolukala, and Paul Rosane. 2023. “Landscape of Climate Finance for Agrifood Systems.” Climate Policy Institute.
e Planet Tracker. 2023. “Financial Markets Roadmap for Transforming the Global Food System.” Planet Tracker.
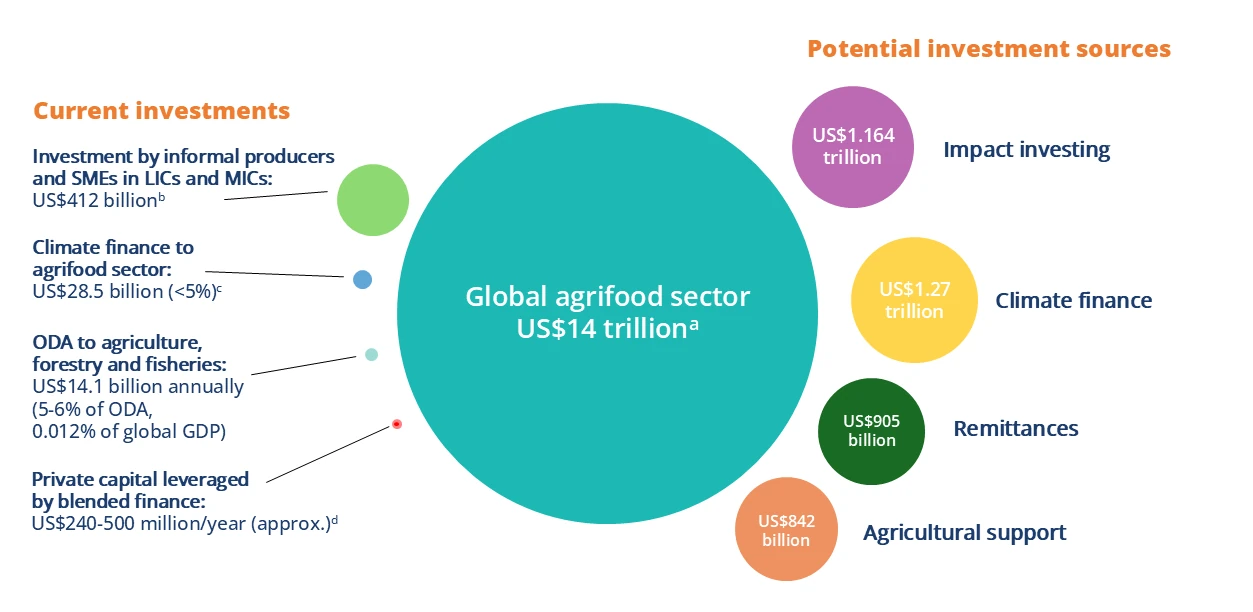
Figure 6 places current investment in agrifood systems in the context of the wider financing landscape. While ODA and DFIs play an important catalytic role, they represent only a small fraction of the overall agrifood economy and the financial resources that could potentially be mobilized. The comparison highlights why transforming agrifood systems cannot rely on aid alone, but requires stronger alignment between public expenditure, private investment, climate finance and other financing sources. Rather than focusing solely on increasing ODA, the challenge is to use limited concessional resources strategically to leverage much larger flows of finance.
a Planet Tracker, “Valuing the global food system”, 21 February 2023.
b See SOFI 2024, chapter 4.1. https://doi.org/10.4060/cd1254en.
c Chiriac, D., Vishnumolakala, H. & Rosane, P. (2023). Landscape of Climate Finance for Agrifood Systems. Climate Policy Initiative.
d IFC, 2021. Using Blended Concessional Finance to Invest in Challenging Markets: Economic Considerations, Transparency, Governance, and Lessons of Experience. World Bank. Accurate data on this figure is difficult to ascertain; this is a rough estimate based on IFC (2021) data. However, relative to other investments and sources of capital, it currently remains small. Note: This figure was originally developed for the GDPRD’s 2025 White Paper “Financing Agrifood Systems for People, Planet and Prosperity”.
4.1 Funding from: official development assistance and other official flows
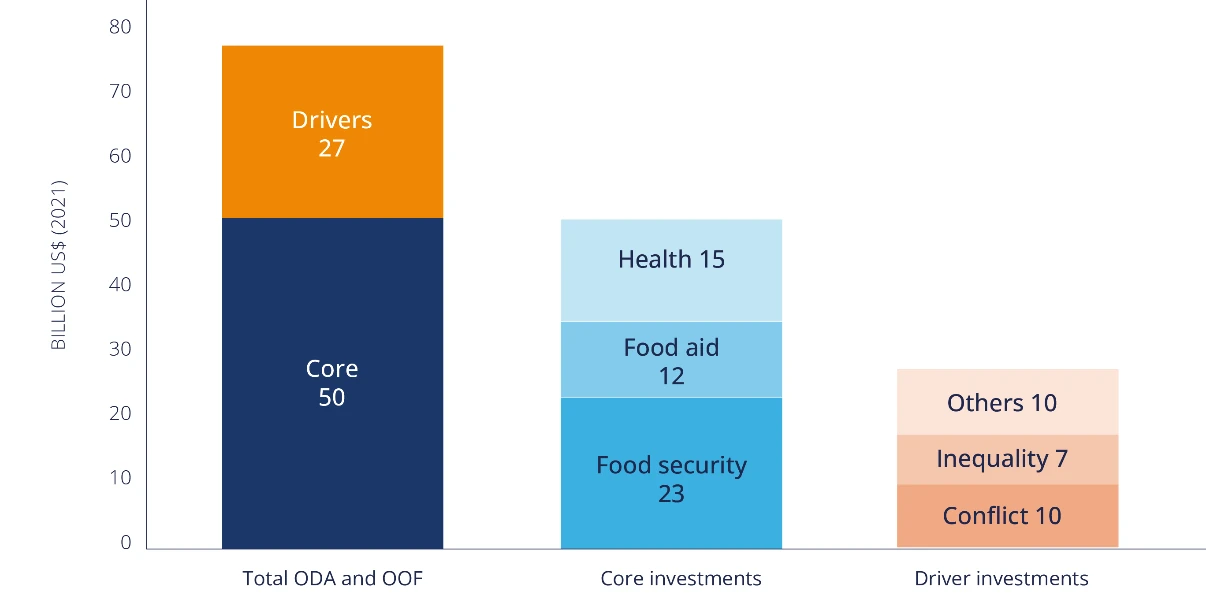
The scale of agrifood systems-related official development assistance and other official flows varies significantly depending on how agrifood systems investments are defined. The SOFI 2024 report estimated that investments in core food security and nutrition activities accounted for approximately 14–16 per cent of total ODA and OOF between 2017 and 2021. When “extended” activities linked to the drivers of food security and nutrition are included, this rises to 22–25 per cent of total ODA and OOF over the same period. Estimates suggest that agrifood systems-related ODA is distributed relatively evenly between multilateral development institutions and bilateral financing, which is further split between grants (58 per cent) and concessional loans (42 per cent).49
Figure 7 illustrates the composition of ODA and OOF investments in food security and nutrition in 2021, directed toward both core (main determinants of food security and nutrition) and extended (major drivers and structural underlying factors) agrifood systems activities.50 Investments in food security and food aid accounted for nearly half (45 per cent) of total flows. Even when applying an extended definition of agrifood systems investments linked to SDG 2 and its associated drivers (including agricultural productivity, rural livelihoods, resilience and support to small-scale producers) more than one-quarter (28 per cent) of financing was directed toward highly vulnerable settings, including conflict response and food aid, while a similarly large share focused more broadly on food security interventions.
Although SDG 2-related investments include important objectives, the composition of current flows demonstrates the continued predominance of immediate food security and humanitarian priorities within ODA financing for agrifood systems. With steady and even increasing numbers of people globally experiencing moderate or severe hunger, and increasing conflict and climate hazards,51 meeting immediate needs related to hunger and malnutrition will likely continue to be a key proportion of ODA for the sector without substantial increases in overall flows and improved coordination to allow for more diversification in investments.
Since early 2025, there has been significant turmoil in ODA, including the closure of USAID, which was formerly the largest donor of ODA. The Financing for Sustainable Development Report 2026 reported the largest annual drop in the history of ODA, marking a 23.1 per cent decline in real terms from 2024 to 2025; cuts by the five biggest ODA providers (Germany, the United States, the United Kingdom, Japan and France) accounted for 95.7 per cent of this decline.52 While these reductions have already had strong immediate impacts, the full implications of this situation are not yet visible.
Even prior to the historic drop in ODA in 2025, the overall trend in recent years still points to a weakening of relative prioritization of agrifood systems investments. Using a narrower definition of food security than that applied in SOFI 2024 (focused on agriculture, forestry, fisheries, nutrition and food aid activities), overall ODA and OOF increased by 20 per cent, while ODA and OOF for agrifood systems increased by only 10 per cent, reducing their share of total ODA and OOF from 7 per cent to 6 per cent. Philanthropic investments in agrifood systems also declined by 22 per cent, from US$1 billion to US$800 million; however, because overall philanthropic investments fell even more sharply (34 per cent), agrifood systems still appear to have remained a relative priority area.53 At the same time, the share of cross-cutting blended finance transactions directed to agriculture declined sharply, falling from 63 per cent in 2019–2021 to 32 per cent in 2022–2024.54
Taken together, these trends suggest that while agrifood systems continue to represent a significant component of development finance, increasing pressure on ODA budgets, combined with growing humanitarian demands and declining relative prioritization of agriculture-focused investments, risks further constraining the financing available for longer-term agrifood systems transformation. Without substantial increases in overall financing volumes, alongside improved coordination and diversification of financing instruments, immediate response needs related to hunger, conflict and climate shocks are likely to continue dominating agrifood systems-related ODA and OOF flows.
4.2 Funding from development finance institutions
Development finance institutions, including multilateral development banks and regional development banks, play a central role in financing agrifood systems through concessional and commercial lending, climate finance, guarantees and blended finance mechanisms. However, estimating the total scale of DFI financing for agrifood systems remains challenging because flows are reported across multiple instruments and financing channels. Some ODA contributions to MDB-managed projects are already captured within broader ODA and OOF estimates, while general replenishment contributions to development banks are reported separately and later allocated across sectors, including agriculture and agrifood systems. In addition, MDBs provide a substantial proportion of global climate finance, and investments related to agriculture and land use can simultaneously be categorized as agrifood systems financing and climate adaptation or mitigation finance.
Despite these limitations, available estimates demonstrate the significant role played by IFIs in agrifood systems financing. In 2021, MDBs provided approximately US$29 billion in financing for agrifood systems through regional development banks.55
Alongside MDB financing, several vertical funds, primarily focused on climate and environmental objectives, also support agrifood systems-related investments. Table 4 summarizes the scale of commitments from selected vertical funds and, where possible, the proportion directed toward agrifood systems-related activities. Together, these major vertical funds have pledged roughly US$32 billion in total financing commitments, although only a proportion of these resources is directly allocated to agriculture, agrifood systems, or rural development activities. These include mechanisms such as the GEF, GCF, the Adaptation Fund, CIF and GAFSP (see table 4 below for more information).
These financing mechanisms demonstrate the growing importance of DFIs and climate-oriented vertical funds within the broader agrifood systems financing landscape. However, financing remains fragmented across institutions, instruments and objectives, with a large share concentrated in climate-related or infrastructure-focused investments rather than broader agrifood systems transformation.
Table 4. Total commitments and commitments for agrifood systems in vertical funds
| Fund | Total committed |
|---|---|
| Global Environment Facility | US$5 billion |
| Global Agriculture and Food Security Program | US$681 million |
| Green Climate Fund | US$12.8 billion (US$2 billion for health, food, and water) |
| Adaptation Fund | US$1.25 billion (13 projects for agriculture, food security and rural development) |
| Climate Investment Funds | US$12 billion |
4.3 National government budgets
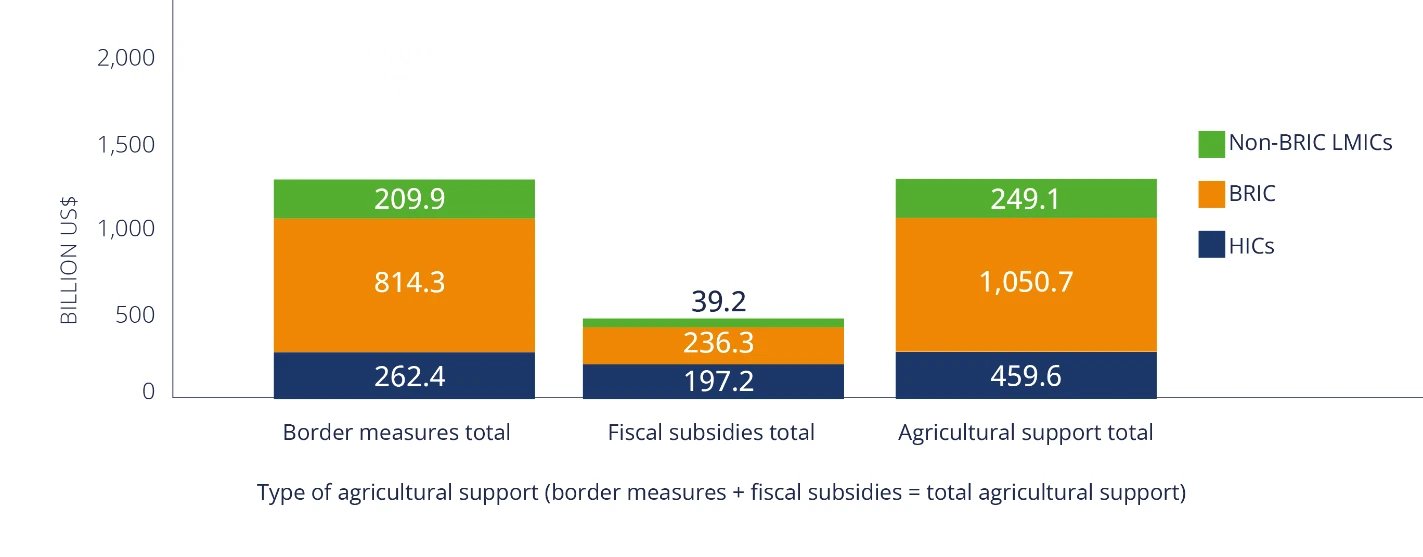
National governments support agrifood systems through a combination of price incentives, fiscal subsidies and public investment programmes, as well as through national development banks and domestic financial institutions. Globally, government support to agricultural producers has averaged around 15 per cent of total agricultural production value.56 However, the scale, composition and objectives of the support varies widely across countries and regions. In many low-income countries, public support to agrifood systems is primarily focused on lowering food costs for consumers, which can have a negative impact on producer livelihoods and the environment. This impact on producers is measured by an index called the nominal rate of assistance (NRA), an indicator measuring the extent to which public policies support or tax agricultural producers relative to world prices. Between 2005 and 2018, the NRA was negative in LICs in all but two years, indicating that, overall, public policies tended to reduce rather than increase producer returns.57 By contrast, MICs maintained a slightly positive NRA, averaging just below 10 per cent in the same period. Figure 8 shows the total value and composition of public support for agrifood systems globally, across HICs, “BRIC” countries – that is, Brazil, Russia, India and China58 – and all other LICs and MICs. Estimates from FAO suggest that, in a business-as-usual scenario, LICs and MICs would spend about US$276 billion annually on agricultural subsidies by 2030. However, the impacts of this support on agrifood systems transformation depend heavily on how these resources are allocated. Even when adjusted for projected population growth,59 BRIC countries are estimated to spend roughly US$73 per capita on agricultural support by 2030, compared to US$10 per capita in all other non-BRIC LICs and MICs.
This difference illustrates the wide disparities in fiscal capacity across developing countries. While larger MICs may be able to provide substantial support to agricultural producers, many LICs operate with significantly more constrained public budgets, limiting their ability to invest in the sector at similar levels. Although agricultural support and public expenditure are not directly equivalent measures, the relatively low levels of per capita support observed in many non-BRIC LICs and MICs are indicative of broader fiscal constraints affecting public investment in agriculture and rural development.
These disparities highlight the constraints that many lower income countries face in adequately supporting their agricultural sectors, including commitments such as the Comprehensive Africa Agriculture Development Programme (CAADP) target of allocating 10 per cent of public expenditure to agriculture and rural development. In addition, CAADP emphasizes the importance of using targeted public investment to mobilize private finance, an objective that remains particularly difficult in high-risk and vulnerable contexts where commercial investment incentives remain weak.
Figure 8. Projected agricultural support in 2030 under the business-as-usual scenario*
In billions of United States dollars
- UNESA. 2024. World Population Prospect. Population Division, United Nations Economic and Social Affairs. https://population.un.org/wpp/Graphs/Probabilistic/POP/TOT/643.
As noted throughout this report, agrifood systems in most LICs and MICs are primarily comprised of small producers and SMEs, and more investment in local agrifood systems (via both public support and private loans) could support local food security.60 Although it is difficult to quantify the exact proportion of their budgets allocated to agriculture, the combination of data on NRA and per capita spending on agricultural support suggests that investments in agriculture in most LICs and MICs are not currently prioritizing areas that would strengthen local agrifood systems, food security and producer livelihoods.
Estimating domestic flows to agriculture and broader agrifood systems can be challenging within individual countries, as well as when comparing or aggregating across countries. To address this challenge, IFAD and the World Bank developed the ”3FS” Tool, through a working group initiated during the 2021 United Nations Food Systems Summit (UNFSS).
4.4 Private sector investment in the agrifood sector
Globally, private finance accounts for nearly two-thirds (63 per cent) of the total asset value of the agrifood sector, representing approximately US$9 trillion of an estimated total sector value of US$14 trillion,61 much of which consists of equity and retained earnings. In addition, an estimated US$630 billion in private capital is potentially available for agrifood systems investment each year.62 However, most of this capital is concentrated in large agrifood companies located in HICs and UMICs. In addition to formal private capital flows, informal investments by producers and SMEs in the agrifood sector in LICs and MICs are estimated at approximately US$412 billion per year.63
Given the scale of available resources, private finance is widely viewed as essential for agrifood systems transformation, particularly as public development finance alone is insufficient to meet estimated investment needs. However, unlike public development finance, private capital is primarily driven by risk-adjusted financial returns, creating major barriers for investment in many agrifood systems activities in LICs and MICs, where returns are often uncertain, fragmented across actors, and exposed to significant climate and market risks.
Recent analysis by the World Economic Forum and Bain & Company64 identifies four major constraints limiting the flow of commercial capital into agrifood systems transformation. First, uncertainty regarding financial returns continues to discourage long-term investment. Second, food production remains highly fragmented, with approximately 600 million smallholder farmers producing around one-third of the world’s food, often requiring technical assistance and other support mechanisms to become investable. Third, inconsistent and inefficient impact measurement frameworks make it difficult for investors to assess outcomes and compare opportunities. Fourth, weak coordination across value chains limits the ability to scale investment efficiently across production, processing, logistics and distribution systems.
These constraints are particularly significant in LICs and MICs, where financing gaps for producers and agrifood SMEs remain substantial despite the importance of these actors within local agrifood systems. As a result, innovative approaches to de-risk investment, strengthen local financial ecosystems, and improve the bankability of agrifood systems activities are increasingly seen as necessary to mobilize private capital at scale for agrifood systems transformation and climate resilience.
4.5 Blended finance
Blended finance is widely regarded as a key mechanism for de-risking commercial lending and mobilizing private capital, especially in vulnerable, fragile, or otherwise high-risk countries and parts of the agrifood system.65 It combines concessional finance from ODA or DFIs with commercial capital from private investors and financial institutions in order to reduce investment risk and improve the attractiveness of investments. Total amounts of blended finance are difficult to estimate, because concessional capital is often already counted in ODA flows, and commercial investments mobilized through blended structures are not consistently tracked across institutions and sectors.
Existing estimates suggest that concessional finance used within blended finance transactions remains relatively limited compared to overall agricultural ODA flows. One estimate found that only around 2 per cent of annual ODA for agriculture is currently used as concessional financing within blended finance structures.66 Despite its relatively limited use, blended finance continues to attract significant attention because of its potential to mobilize additional commercial capital beyond the initial concessional investment.
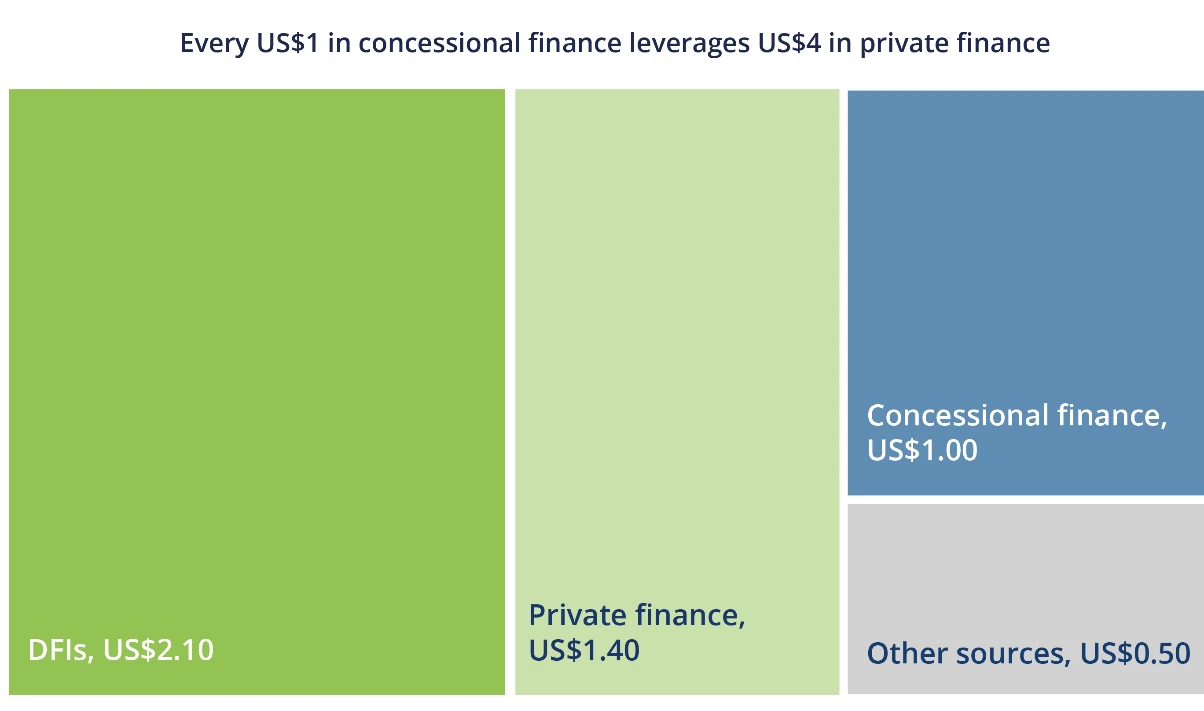
Figure 9 illustrates the potential leverage effect of concessional finance, showing that it can mobilize several times its value in additional commercial capital within blended finance structures. However, mobilization rates in agriculture remain significantly lower than in other sectors. Current estimates show that only 5-10 per cent of investments by DFIs and MDBs in agriculture mobilize private finance,67 highlighting the difficulty of crowding commercial capital into higher-risk agrifood investments. Furthermore, analysis by the GDPRD and Shamba Centre for Food & Climate68 highlights that DFIs use their own concessional funds to leverage their own commercial financing, noting that blended finance that uses concessional loans from DFIs is not necessarily crowding in new investors, nor expanding the overall pool of capital. Thus, leverage ratios alone
may overstate the extent to which blended finance mobilizes truly additional private capital that would otherwise not have been invested.
As discussed in previous sections, much of the investment available to agrifood systems globally remains concentrated in lower-risk and higher-return investments. Consequently, agrifood SMEs and small-scale producers in LICs and MICs continue to face major barriers in accessing finance. Several reports identify a substantial financing gap for SMEs requiring between US$50,000 to US$5,000,000 in financing (otherwise known as “the missing middle”), because commercial lenders frequently perceive these investments a high risk, with some studies estimating average losses of around 10 per cent on these loans.69 As such, flexible, patient capital remains essential to support investments in these segments. Re-orienting even a small proportion of private finance toward higher-risk investment opportunities, using both concessional financing and other innovative finance approaches (see
Table 2 above and Section 5 below), could significantly expand overall access to capital for food system actors in LICs and MICs
Alongside traditional DFI-led blended finance structures, several innovative blended finance vehicles have emerged to support sustainable agriculture, land use and agrifood systems transformation. Examples include:
- Land Degradation Neutrality (LDN) Fund,70 which closed in 2021 with US$208 million in commitments to finance sustainable land management, agroforestry and regenerative agriculture investments.
- The AGRI3 Fund, which mobilizes US$145 million in concessional financing with the objective of leveraging up to US$900 million in commercial investment for climate-smart agriculture and sustainable supply chains.
- Aceli Africa, which works to mobilise private capital for agri-SMEs, reaching US$440 million with a ten-fold leverage.
- AgDevCo, which manages around US$90 million in concessional capital alongside a broader portfolio of leveraged investments worth roughly US$280 million, supporting agribusiness development across Africa.
- The Food Securities Fund, which aims to raise just over US$50 million in concessional capital to catalyse US$734 million in commercial financing.
- The Acumen Resilient Agriculture Fund (ARAF), launched in 2022, which combines concessional first-loss capital with commercial equity to support climate-resilient agribusinesses serving smallholder farmers.
- The Financing Agricultural SMEs in Africa (FASA) Fund, launched in 2023 by development partners including USAID and Norad, which aims to unlock financing for agricultural SMEs through blended capital structures and local financial intermediaries.
- Mobilising Finance for Forests (MFF), a blended finance programme capitalized with about £150– 225 million in public funding to mobilize up to £850 million in private investment for sustainable forest and land-use projects in tropical regions.
Overall, blended finance has significant potential to help mobilize additional private capital for agrifood systems transformation, particularly in areas linked to climate resilience, sustainable land use, and agricultural SMEs. However, current financing volumes remain insufficient, and blended finance alone is unlikely to close existing investment gaps without broader increases in concessional funding, stronger domestic financial ecosystems, and improved mechanisms for reducing risk and transaction costs in agrifood investments.
4.6 Climate finance
Food and agriculture systems are responsible for roughly one-third of total greenhouse gas emissions71, while also holding the potential to mitigate up to 20 per cent of emissions.72 Yet, climate finance directed to agrifood systems remains disproportionately low.
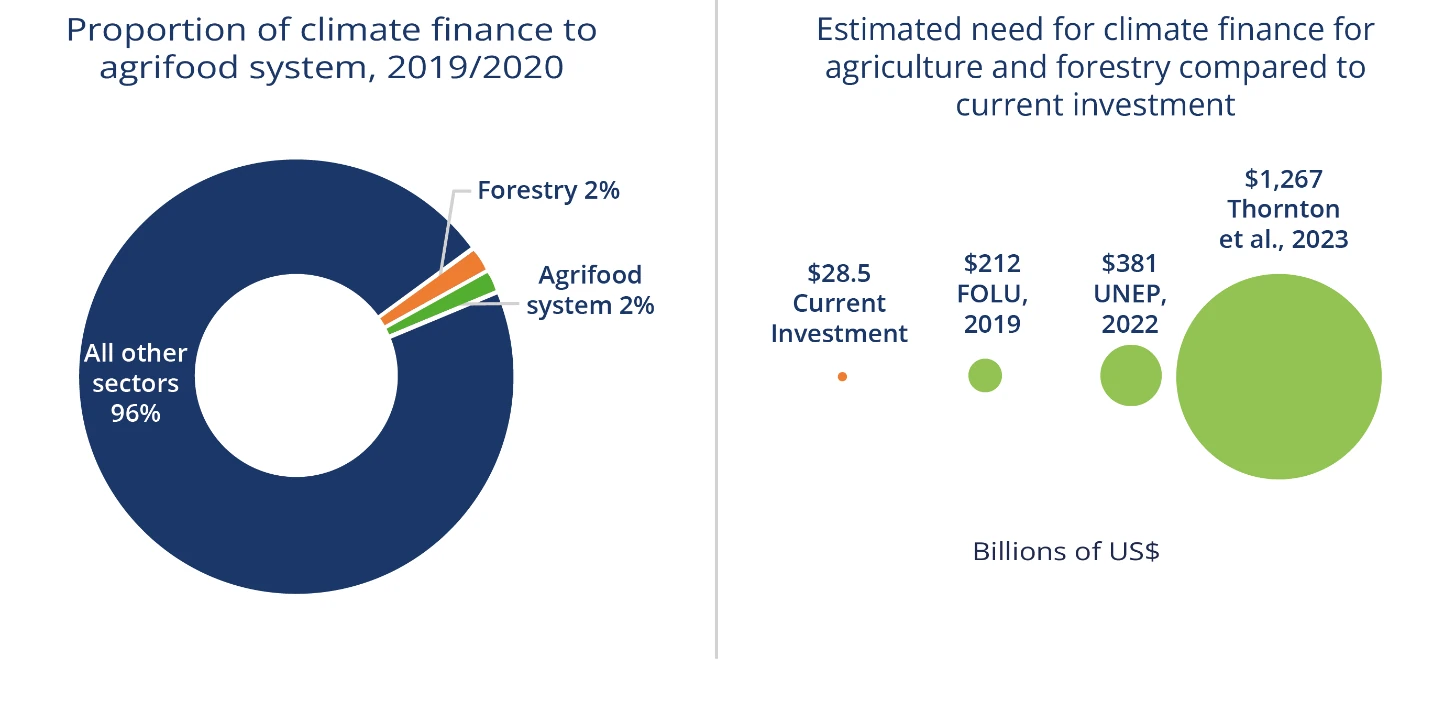
In 2019/2020, agriculture and forestry received an estimated US$28.5 billion, representing around 4 per cent of total climate finance. Within these flows, financing is fragmented, with approximately 42 per cent directed to agriculture and 41 per cent to forestry, with the remainder supporting multiple areas, as well as fisheries, diet, and national policy. Additionally, US$4.8 billion of private climate finance was invested by companies within their supply chains or supply sheds.73
Despite these already modest levels, more recent evidence suggests that the relative share of climate finance for agrifood systems has further declined, dropping to 2.5 per cent (about US$16.3 billion) in 2022, as investment in sectors such as energy and transport expanded more rapidly.74 Estimates suggest that climate finance for agriculture and agrifood systems would need to increase by a factor of 10 to 45 to meet global needs.75
While overall climate finance has increased in recent years, with public flows surpassing US$100 billion,76 these gains have not translated into a proportional increase for agrifood systems. Moreover, the limited finance that reaches agrifood systems remains heavily concentrated in public resources, estimated at 86 per cent of total climate finance to agrifood systems in 2023.77 This underscores both the central role of public actors and the persistent challenge of mobilizing private capital investments.
One approach to addressing this gap has been the use of blended climate finance for agrifood systems. For example, the International Finance Corporation has used US$624 million in concessional donor funds to mobilize US$1.7 billion in its own financing and US$5.1 billion in private investment, leveraging approximately US$10 in commercial finance for every US$1 of concessional funding.[^78] However, overall funding levels remain insufficient to significantly scale such mechanisms or crowd in private capital at the level required.
Figure 10 illustrates both the limited share of climate finance directed to agriculture and forestry and the scale of the financing gap identified across recent studies.
Chiriac, D., Vishnumolakala, H. and Rosane, P.], 2023. Landscape of Climate Finance for Agrifood Systems*. Climate Policy Initiative.
Notes
-
The methodology piloted in the SOFI 2024 report (see here) expands the set of DAC codes that count, and utilizes an extensive list of keywords to try to expand the definition and add precision the geography and purpose of financing flows for food security and nutrition. ↩
-
Laborde, D., Parent, M. and Smaller, C. 2020. Ending Hunger, Increasing Incomes, and Protecting the Climate: What Would It Cost Donors? Ceres2030. International Institute for Sustainable Development and International Food Policy Research Institute. ↩
-
Full definition of core and extended found in Figure 15 of the State of Food Security and Nutrition in the World 2024 report. ↩
-
GDPRD. 2021. Donor Contributions to Food Systems. Global Donor Platform for Rural Development. ↩
-
https://financing.desa.un.org/sites/default/files/2026-04/FSDR2026_ODA%20data%20update.pdf. ↩
-
All data above from OECD-DAC CRS database. Sourced – but reflects 2024 spending normalised to 2023. ↩
-
Perera, O., Smaller, C., El Harty, K. and Lefebvre, L. 2024. Unleashing the Catalytic Power of Donor Financing to Achieve Sustainable Development Goal 2: Technical note. Global Donor Platform for Rural Development and Shamba Centre for Food & Climate. ↩
-
FAO, UNDP, and UNEP. (2021). A multi-billion-dollar opportunity – Repurposing agricultural support to transform food systems. ↩
-
Ibid. ↩
-
In the referenced report, the four BRIC countries are separated out, but South Africa is not included in this group. ↩
-
UNESA. 2024. World Population Prospect. Population Division, United Nations Economic and Social Affairs. https://population.un.org/wpp/Graphs/Probabilistic/POP/TOT/643 ↩
-
Perera, O., Smaller, C., El Harty, K. and Lefebvre, L. 2024. Unleashing the Catalytic Power of Donor Financing to Achieve Sustainable Development Goal 2. Global Donor Platform for Rural Development and Shamba Centre for Food & Climate. ↩
-
Planet Tracker. 2023. “Financial Markets Roadmap for Transforming the Global Food System.” Planet Tracker. ↩
-
Ibid. ↩
-
SOFI 2024. https://doi.org/10.4060/cd1254en. ↩
-
“Putting Food on the Balance Sheet: Financing Strategies to Scale Investment in Food Systems” — WEF & Bain & Company (2025) - https://reports.weforum.org/docs/WEF_Putting_Food_on_the_Balance_Sheet_2025.pdf. ↩
-
IFC, 2021. Using Blended Concessional Finance to Invest in Challenging Markets: Economic Considerations, Transparency, Governance, and Lessons of Experience. World Bank. ↩
-
Perera, O., Smaller, C., El Harty, K. and Lefebvre, L. 2024. Unleashing the Catalytic Power of Donor Financing to Achieve Sustainable Development Goal 2: Technical note. Global Donor Platform for Rural Development and Shamba Centre for Food & Climate. ↩
-
IFC, 2021. Using Blended Concessional Finance to Invest in Challenging Markets: Economic Considerations, Transparency, Governance, and Lessons of Experience. World Bank. ↩
-
See footnote 71. ↩
-
IFC, 2021. Using Blended Concessional Finance to Invest in Challenging Markets: Economic Considerations, Transparency, Governance, and Lessons of Experience. World Bank. ↩
-
https://www.unccd.int/land-and-life/land-degradation-neutrality/impact-investment-fund-land-degradation-neutrality ↩
-
Crippa, M., E. Solazzo, D. Guizzardi et al., “Food systems are responsible for a third of global anthropogenic GHG emissions”, Nature Food, vol. 2, 2021, pp. 198-209, https://www.nature.com/articles/s43016-021-00225-9#citeas. ↩
-
Global Alliance for the Future of Food, Untapped Opportunities Climate Financing for Food Systems Transformation, 2022, https://futureoffood.org/wp-content/uploads/2022/10/climatefinancereport-english.pdf. ↩
-
Chiriac, D., Vishnumolakala, H. and Rosane, P.], 2023*. Landscape of Climate Finance for Agrifood Systems*. Climate Policy Initiative ↩
-
Global Alliance for the Future of Food. Public Climate Finance for Food Systems Transformation (2024 update). N.p.: Global Alliance for the Future of Food, 2024. ga_climatefinancereport_2024.pdf ↩
-
Chiriac, D., Vishnumolakala, H. and Rosane, P.], 2023*. Landscape of Climate Finance for Agrifood Systems*. Climate Policy Initiative ↩
-
Mitchell, I., and Wickstead, E. 2024. “Has the $100 Billion Climate Goal Been Reached?” Center for Global Development. ↩
-
Naran, B, Buchner, B., Price, M., Stout, S., Taylor, M., and Zabeida, D. 2024. Global Landscape of Climate Finance 2024. Climate Policy Initiative. IFC, 2021. Using Blended Concessional Finance to Invest in Challenging Markets: Economic Considerations, Transparency, Governance, and Lessons of Experience. International Finance Corporation, World Bank Group. ↩